All we can do is be 100% ready, watch and wait, and not be distracted by thinking that the base forming process will never end. We should instead be focusing on the fact that gold is already up 11% this year, while silver has risen almost 7%. By any normal measure, these are good results, but I expect more to come as we head toward the close of the year.
There are some key points to keep in mind. Most importantly, the low price in both gold and silver occurred in December of 2015. That’s nearly two years ago. Since then, both gold and silver have been in rising uptrends within the huge bases both metals are forming. There is no reason to expect those uptrends will end any time soon, given all the reasons that will eventually send gold and silver much higher. These reasons include the banking and other financial problems we see all over the world as well as the mountains of debt that governments are building. These debts will never be repaid with the same purchasing power of the money used by the lenders to finance those debts, particularly in today’s world of central bank financial repression and low-to-zero interest rates. Inflation is visibly rising and is going to get worse.
All of this means that we should not be misled by the relative quiet in the precious metals at present. The following silver chart of daily spot prices in London indicates that the precious metals are setting up beautifully, Eric. So we should be getting ready for what looks like a big move higher in silver as well as gold as we move toward the end of the year (see chart below).
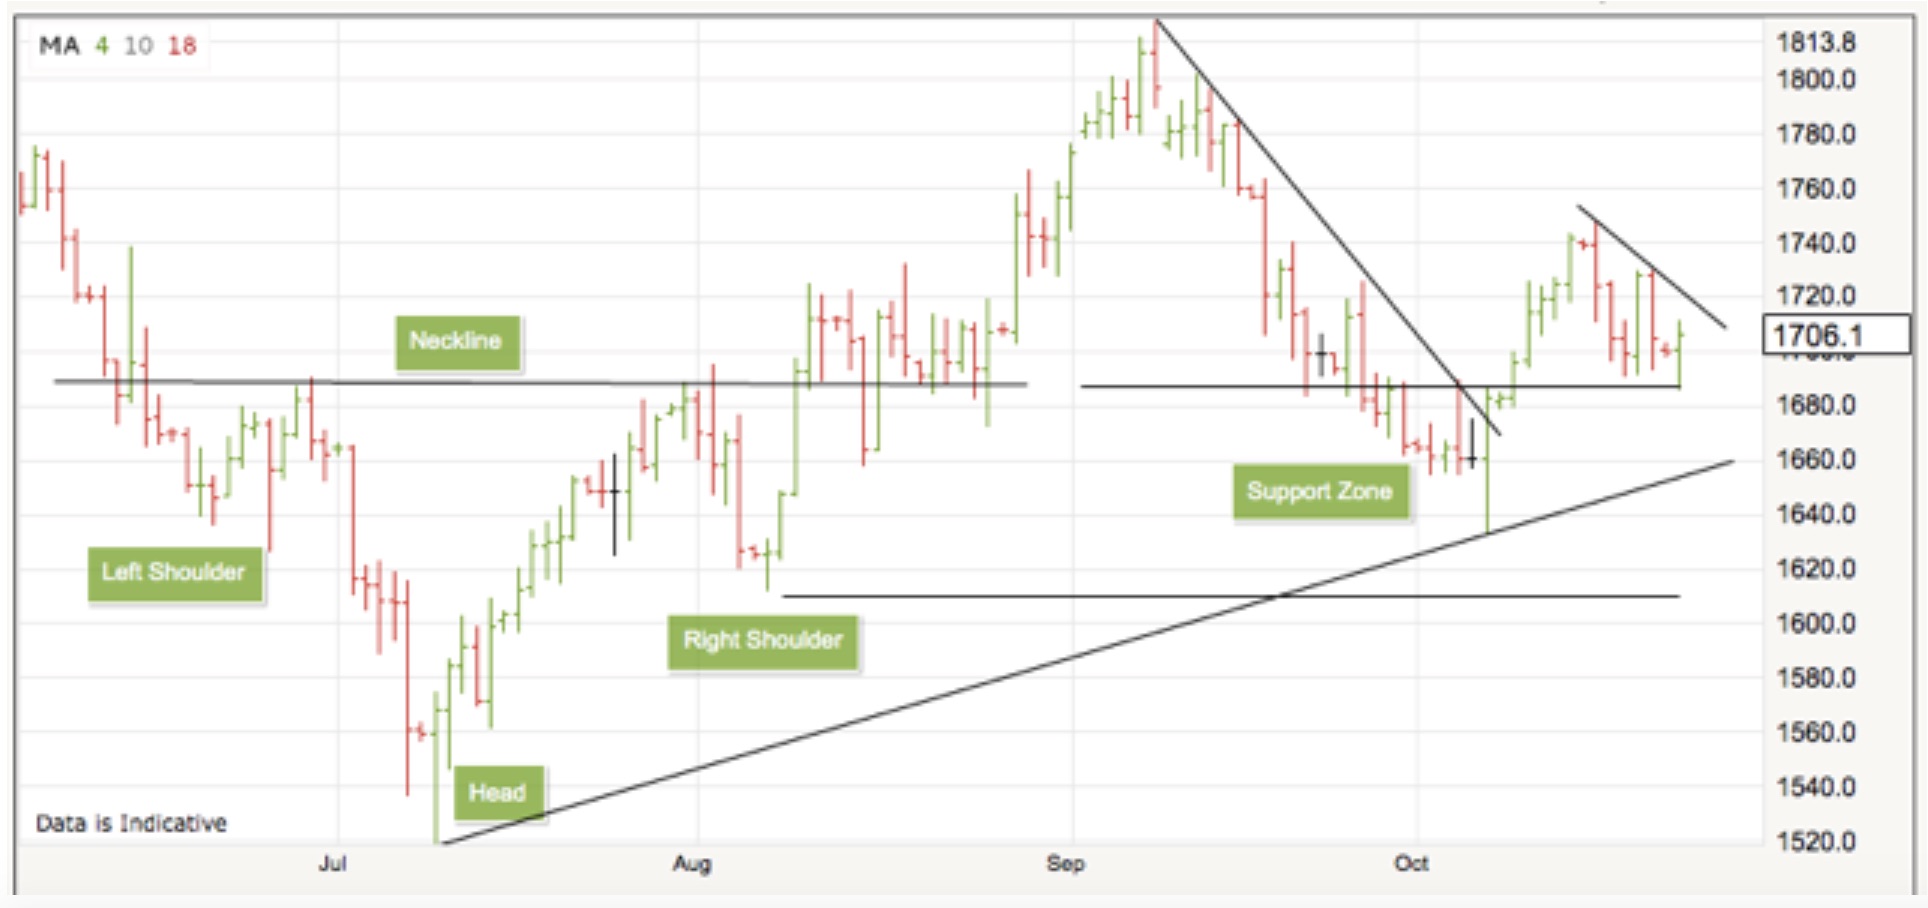
There a few key points about this chart. First, we see the clear reverse head-and-shoulders pattern silver formed over the quiet summer months. Physical silver was being accumulated during this period. When this buying eventually overpowered the shorts, silver broke above the neckline of the head-and-shoulders pattern, and climbed higher until hitting resistance in the $1820 area. As is not uncommon after a break-out, silver then retraced back to the support zone, which I’ve marked on the chart between the two horizontal lines.
The big one-day swoon into the support zone with the same day upside reversal on Oct 6th is significant. The central planners tried to push silver lower, but failed. The only thing that happened was a lot of sell stops were hit, enabling the big players to cover shorts.
- Source, James Turk via King World News