buy gold and silver bullion

Wednesday, November 29, 2017

Will Bitcoin Replace Gold's 10,000 Year History as a Store of Value?


Alasdair Macleod, runs FinanceAndEconomics.org, and is on the GoldMoney board, talks about gold and crypto-currency and the future for both.
Will gold continue to stand the test of time? Will its 10,000 year history as a store of value suddenly be erased? Unlikely.

- Source, Jay Taylor Media
Sunday, November 26, 2017

James Turk: A Moment Of Crisis For Central Planners

Given what the central planners have thrown at gold and silver the last six years, a 1.1% ‘plunge’ is not only a welcome relief, it is giving us an important message. The conclusion from this event is that 40,000 Comex contracts trading in a span of 10 minutes did so little damage to the gold price, it is a clear sign that the central planners are up against an immovable force. And we know what that force is — all the national currencies they are printing and debasing from QE and their other schemes is not only going into daVinci’s and other tangible assets, it is also going into gold and silver.

So here is what we face, Eric. Will the central planners dare throw another 40,000 contracts at the market to try reaching their sweet spot and risk having to come up with more physical metal for that portion of the buyers asking for delivery? Or are gold and silver finally going to break out of their respective bases and head higher, ending this period of extreme undervaluation? Only time will tell, of course, but instead of more base building or a drop back to the central planners’ sweet spot, I expect an upside breakout soon, and the tightness in the physical market suggests it may be just days away.”

- Source, James Turk via King World News

Thursday, November 23, 2017

Bullion Banks Desperate To Trigger Sell Stops

They have been trying to push silver lower for weeks in an attempt to reach that target area in order to create that wave of selling by triggering the sell stops. It’s a game that they have been playing for years.

Triggering those sell stops will give the syndicate of bullion banks, who act as agents for the Fed and other Western central banks, an opportunity to cover many of their short positions in the silver market. Thus, they have been selling loads of paper silver in a desperate attempt to thwart the tidal wave of buying coming into the Comex. And it is a tidal wave.

Also of importance is the fact that the EFPs have ballooned in recent days, particularly for gold. Flat gold and silver prices in the face of soaring Open Interest would be a blatant sign of price manipulation. So the central planners are frantically shifting their shorts to the London OTC market in an attempt to keep Comex open interest from soaring, but all of their selling has been to little avail. Despite numerous attempts to crack silver, they have failed. The same is true for gold.

The central planners even got the mainstream media working for them. For example, a few days ago Bloomberg reported: “Mysterious Gold Trades of 4 Million Ounces Spur Price Plunge.” Obviously the word “plunge” was meant to scare, but hidden in the article was the actual result of this huge sale. To quote the article, there was “a sell-off, sending prices down as much as 1.1 percent.”

- Source, James Turk via King World News

Monday, November 20, 2017

The War In The Gold and Silver Markets Heats Up

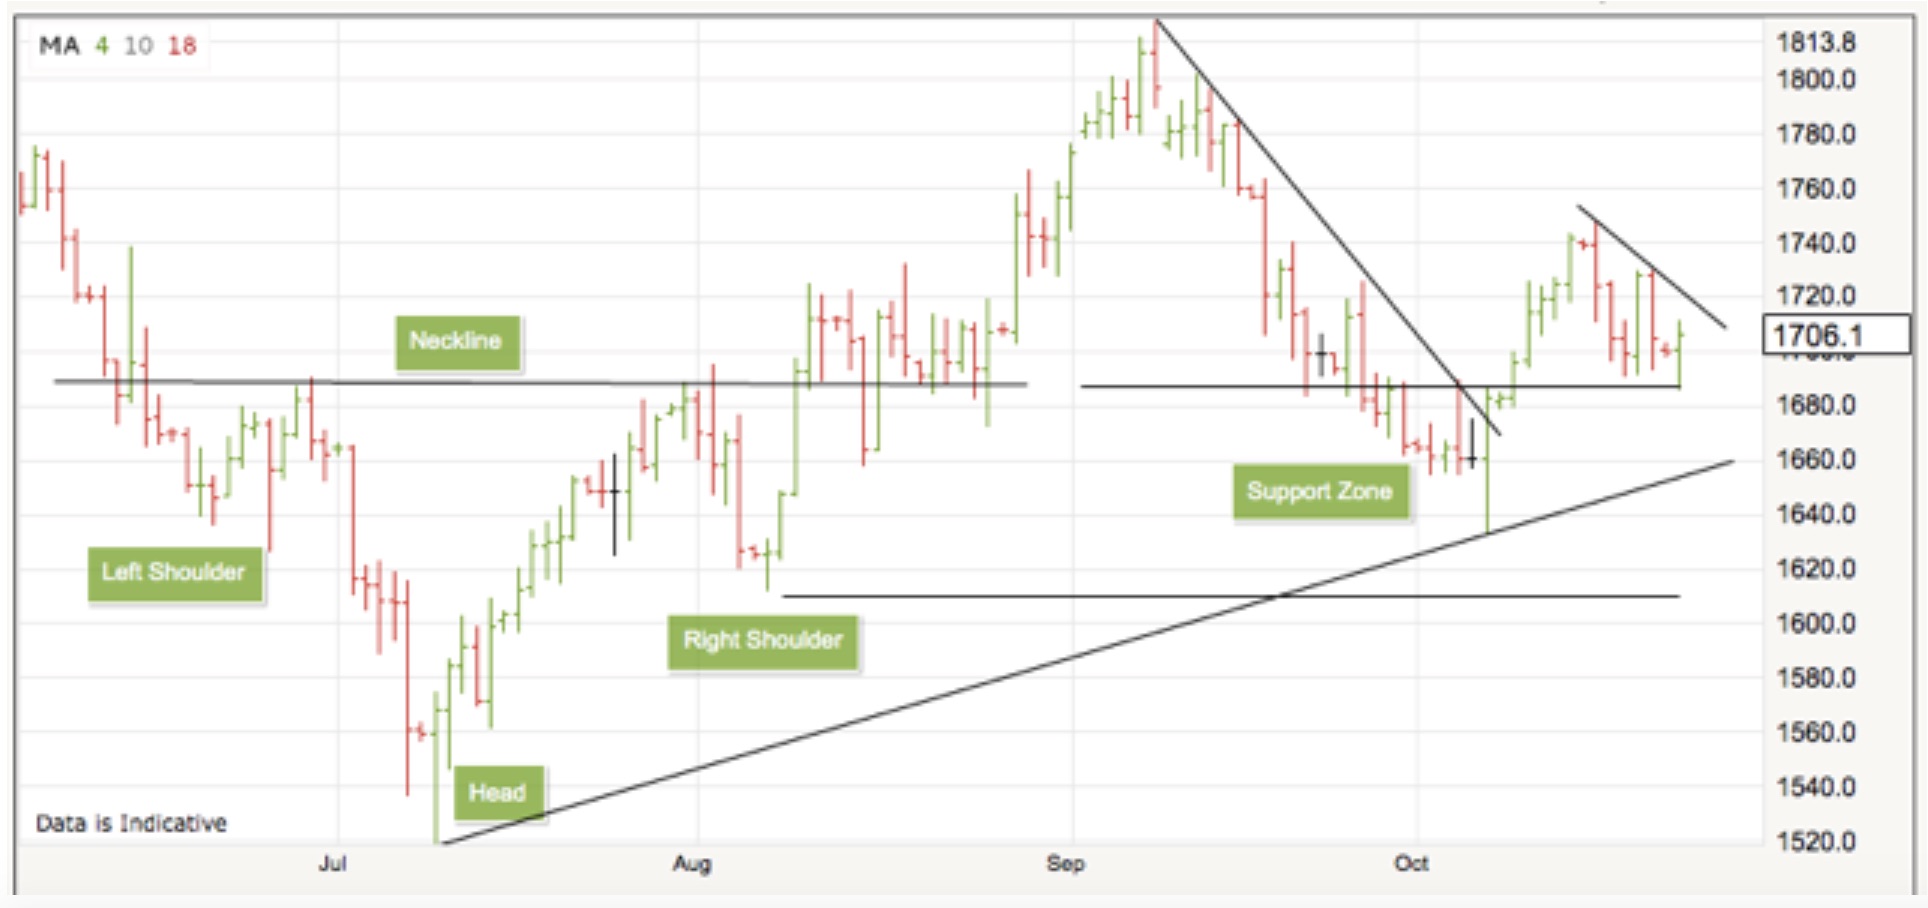
Both gold and silver have done a lot of base building, and the breakout from their bases is getting close. Last time we spoke I wasn’t ready to hazard a guess when the breakout would happen because there is no way to predict when a base will end with a breakout. And there still isn’t. But look at the following chart showing the daily spot silver price in London.


Even though both gold and silver are positioned pretty much the same, I want to use this silver chart because its picture is much clearer. Also, even though both metals are trading backwardated in London, the backwardation is much deeper in silver, so it has greater upside potential when the breakout occurs. Meaning, the gold/silver ratio will fall as silver outperforms gold.

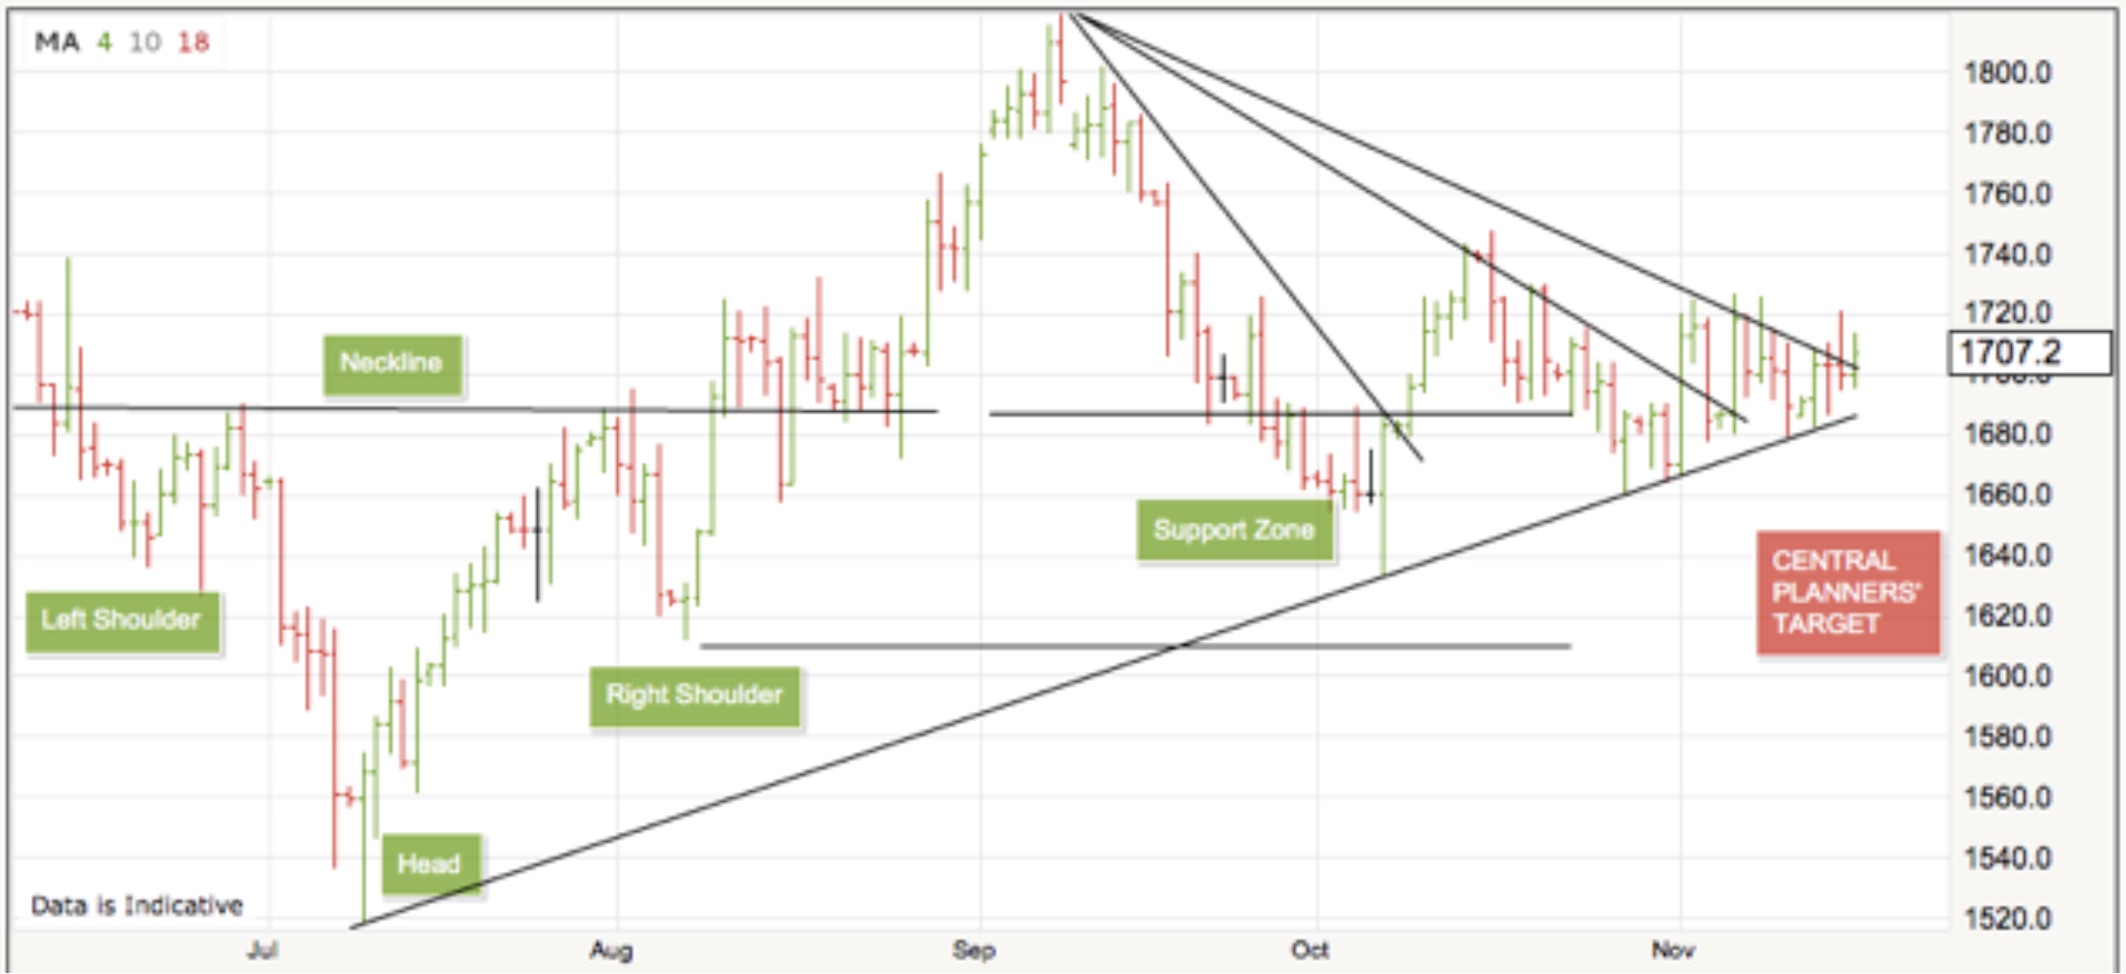
The point here, Eric, is that silver looks very close to a breakout and ready to start climbing higher. The chart above also shows the head-and-shoulders pattern that we have previously spoken about (highlighted in green rectangles). The three downtrend lines show how silver keeps getting beaten back in its attempts to break higher, which it is once again trying to do as it moves day-by-day toward the point of the large triangle.

- Source, King World News

Friday, November 17, 2017

James Turk: Despite Pullbacks, A Huge Bull Move Is Coming

That one-day reversal led to another small uptrend, and here we are again with silver testing support once more. But note the big uptrend line going back to this summer’s low price. That uptrend remains intact. What it all means, Eric, is this picture for silver is very positive. And gold is much the same. But returning to my original point, we continue to watch their bases develop. While doing so, we should continue to accumulate physical gold and silver in anticipation of much higher prices in the months immediately ahead.

- Source, James Turk via King World News

Tuesday, November 14, 2017

Key Chart Forecasts A Major Surge In The Price Of Silver

There are few things as boring as watching the precious metals form a base, Eric. Sometimes this process can seem endless, like at present. Unfortunately, there is no way to predict when a base will end. But when it does, a breakout from a base always sends the precious metals higher…

All we can do is be 100% ready, watch and wait, and not be distracted by thinking that the base forming process will never end. We should instead be focusing on the fact that gold is already up 11% this year, while silver has risen almost 7%. By any normal measure, these are good results, but I expect more to come as we head toward the close of the year.

There are some key points to keep in mind. Most importantly, the low price in both gold and silver occurred in December of 2015. That’s nearly two years ago. Since then, both gold and silver have been in rising uptrends within the huge bases both metals are forming. There is no reason to expect those uptrends will end any time soon, given all the reasons that will eventually send gold and silver much higher. These reasons include the banking and other financial problems we see all over the world as well as the mountains of debt that governments are building. These debts will never be repaid with the same purchasing power of the money used by the lenders to finance those debts, particularly in today’s world of central bank financial repression and low-to-zero interest rates. Inflation is visibly rising and is going to get worse.

All of this means that we should not be misled by the relative quiet in the precious metals at present. The following silver chart of daily spot prices in London indicates that the precious metals are setting up beautifully, Eric. So we should be getting ready for what looks like a big move higher in silver as well as gold as we move toward the end of the year (see chart below).


There a few key points about this chart. First, we see the clear reverse head-and-shoulders pattern silver formed over the quiet summer months. Physical silver was being accumulated during this period. When this buying eventually overpowered the shorts, silver broke above the neckline of the head-and-shoulders pattern, and climbed higher until hitting resistance in the $1820 area. As is not uncommon after a break-out, silver then retraced back to the support zone, which I’ve marked on the chart between the two horizontal lines.

The big one-day swoon into the support zone with the same day upside reversal on Oct 6th is significant. The central planners tried to push silver lower, but failed. The only thing that happened was a lot of sell stops were hit, enabling the big players to cover shorts.

- Source, James Turk via King World News

Friday, November 10, 2017

James Turk Discusses The Use Of Leverage In Gold and Silver

Leverage is the use of credit or borrowed capital to increase the earning potential of your investment portfolio. But like everything else in finance, higher returns mean higher risk, so leverage is not for everyone.

Nevertheless, leverage can be a useful tool for those accepting the risk. If you choose to use it to maximise the return of your gold and silver, there are two key factors to getting it right.

First, use leverage when the trend is in your favour. So how do you identify the trend? Here are a couple of popular methods.

1) Moving Average – A moving average is constructed by calculating the daily closing price over a period of time. Different time periods can be used for different markets, but for gold and silver, the 21-day and 200-day moving averages are popular measures of short-term and long-term trends.

When using moving averages, the rule is to be in harmony with the trend. This is accomplished by owning gold and silver when their price is above the moving average and the moving average itself is rising. Conversely, if you are trading precious metals as opposed to accumulating it, be out of the market if either or both of these conditions are not met.

It sounds easy, but it’s not. To assist you in identifying the trend, trendlines can be particularly helpful when used in conjunction with a moving average, as illustrated in the following chart of silver’s daily closing price in London.


Note the clear uptrend in the silver price and the downtrends. Note also that a new uptrend in price is just beginning because the silver price is above its 21-day moving average, which itself is turning higher and rising. If history is any guide, now is the time to buy and possibly leverage your purchase with additional silver, if you believe the risk/return suits your investment criteria.

2) Higher Lows – Prices can also point out the trend. For example, the gold price declined from its record high of $1910 per ounce in August 2011 to December 2015 when it reached $1055. Then prices began to rise. Gold eventually retraced that rise, and in December 2016 fell back to $1125, 6.6% above the low price a year earlier.

This year there have been two further retracements occurring after the gold price rose. These advances and retracements are normal patterns, but the important point is that the low price in March was higher than the previous low in December 2016. Similarly, the July low price was higher yet again.

This pattern of rising lows is telling us that the gold price is in an uptrend, as can be seen in the following chart of gold’s weekly closing price in London, with its 21-week moving average that is also rising. So as is the case with silver, now is the time to buy gold and possibly leverage your purchase with additional gold, if you believe the risk/return suits your investment criteria.


Traders and investors have been using these and other techniques throughout the ages to identify price trends. They are not fool proof; nothing is when it comes to investments. But these techniques are useful tools that have proven helpful over time.

View leverage to also be a tool, and like any tool, it needs to be used wisely – or not at all.

- Source, Gold Seek

Tuesday, November 7, 2017

Yellen and Carney Are Signalling that the Time is Right to Buy Gold and Silver


We will be lucky if this expansionary phase lasts beyond the end of 2018, given the restricted headroom for increases in interest rates for the four major currencies. But there’s one asset that is poorly understood in western financial markets, and that’s physical gold.

In the short term, the prospect of rising interest rates can be expected to be read as a negative factor for precious metals. This is because market speculators in Western capital markets are used to trading gold as the mirror image of the dollar. If the dollar is strengthening, gold will weaken. If interest rates are rising, the dollar strengthens. Therefore, the logic goes, sell your gold. This may be true during the recovery phase of the credit cycle, when increases in interest rates, or just the threat of them, will be judged by markets as an anticipatory action, leading to a stronger currency.

In the expansionary phase, central banks react belatedly, for the reasons described above. It changes the fundamental relationship between monetary policy and the gold price from that which persisted in the recovery phase of the credit cycle. We have seen gold suppressed during the recovery phase, once fears of financial and system collapse receded, but the dollar price of gold has more recently been rising, erratically perhaps, since December 2015. Bond yields bottomed out six months later, with the yield on the 5-year US Treasury nearly doubling to 1.9% today. We can take this as evidence of an evolution in market relationships, because gold and short-term bond yields are both rising. This change in relationship effectively confirms we have already moved from recovery to expansion in the credit cycle.

Central banks are already behind the curve, and will become more so. The gold price can be expected to strengthen during the expansionary phase of the credit cycle, reflecting the declining purchasing power of fiat currencies and the trend towards negative real interest rates. This was certainly the case in the US’s expansionary phase of the late 1970s, when dollar inflation was threatening to escalate out of control.

A rising gold price also accords with rising commodity prices, all measured in declining fiat currencies. We are already in the initial stages of credit expansion, signaled by the wake-up call from Ms Yellen and Mr Carney, so it also serves as a signal that industrial commodity prices will rise. Their prices are already rising, so the markets are telling us the purchasing power of the dollar, as well as the other fiat currencies, are commencing a new decline measured in industrial materials. And while in the very short-term precious metals may need to adjust further to the change in credit cycle relationships, above all, Yellen and Carney are effectively signalling that the time is right to buy gold and silver.


- Source, Alasdair Macleod of James Turk's Gold Money

Saturday, November 4, 2017

The Upcoming increase in Interest Rates

Last week, both Janet Yellen of the Fed and Mark Carney of the Bank of England prepared financial markets for interest rate increases. The working assumption should be that this was coordinated, and that both the ECB and the Bank of Japan must be considering similar moves.

Central banks coordinate their monetary policies as much as possible, which is why we can take the view we are about to embark on a new policy phase of higher interest rates. The intention of this new phase must be to normalise rates in the belief they are too stimulative for current economic conditions. Doubtless, investors will be reassessing their portfolio allocations in this light.

It should become clear to them that bond yields will rise from the short end of the yield curve, producing headwinds for equities. The effects will vary between jurisdictions, depending on multiple factors, not least of which is the extent to which interest rates and bond yields will have to rise to reflect developing economic conditions. The two markets where the change in interest rate policy are likely to have the greatest effect are in the Eurozone countries and Japan, where financial stimulus and negative rates have yet to be reversed.

Investors who do not understand these changing dynamics could lose a lot of money. Based on price theory and historical experience, this article concludes that bond yields are likely to rise more than currently expected, and equities will have to weather credit outflows from financial assets. Therefore, equities are likely to enter a bear market soon. Commercial and industrial property should benefit from capital flows redirected from financial assets, giving them one last spurt before the inevitable financial crisis. Sound money, physical gold, should become the safest asset of all, and should see increasing investment demand.

Assessing potential outcomes of this new phase of monetary policy is a multi-dimensional puzzle. There’s the true state of the economy, the phase of the credit cycle, and the understanding, or more accurately the lack of it, of the relationships between money and prices by policy makers. This article is aimed at making sense of these diverse factors and their interaction. We start by examining the intellectual deficit in economic and price theory to improve our understanding of where the policy mistakes lie, the resulting capital flows that will determine asset values, and therefore the likely outcomes for different asset classes.

Interest rate fallacies
The most egregious error made by central banks and economists alike is the assumption that gradually raising interest rates acts as a brake on the rate of economic expansion, and therefore controls price inflation. Economic commentators generally regard interest rates as the “price” of money. It is from this fallacy that the belief arises that manipulating interest rates has a predictable effect on the demand for money in circulation relative to goods, and therefore can be used to target price inflation. This line of reasoning makes even a sieve look watertight. Interest rates are the preserve of the future exchange of goods relative to today, and have nothing to do with the quantity of money. They only determine how it is used. In a free market, rising interest rates tell us that demand for credit is increasing relative to demand for cash, while falling interest rates indicate the opposite. What matters are the proportions so allocated, and not the total.

Therefore, if a central bank increases interest rates, it will be less demanded in the form of credit. In the past, before consumer credit became the dominant destination of bank credit over industrial production, increasing interest rates would discourage marginal projects from proceeding, and it would make many projects already under way uneconomic. Raising interest rates therefore acted to limit the production of goods, and not the demand for them. In the first stages of a central bank induced rise in interest rates, the limit placed on the supply of goods is even likely to have the effect of pushing prices higher for a brief time or encouraging import substitution, given the stickiness of labour markets because a rise in unemployment is yet to occur.

It should be apparent that management of interest rates before consumer debt came to dominate credit allocation was never going to work as a means of regulating the quantity of money, and therefore price inflation. Nowadays, new credit allocation is less angled at increasing and improving production, and its greater use is to finance mortgages and consumption. This is particularly true in the US and UK, but generally less so elsewhere.

Therefore, the consequences of managing interest rates are different from the past in key respects. Raising interest rates does not, in the main, reduce consumer demand for credit, except on mortgages, which we will come to in a minute. Credit cards and uncollateralised bank overdrafts typically charge as much as 20% on uncleared balances, even at times of zero interest rate policy, demonstrating their lack of interest rate sensitivity. The same is true of student debt.

Interest on motor loans and similar credit purchases are set not by central bank interest rate policy, but by competition for sales of physical product. Manufacturers have two basic sources of profit: the margin on sales, and the profits from their associated finance companies. It matters not to them how the sum of the two add up. If wholesale interest rates rise, squeezing their lending margins, they can subsidise their finance operations by discounting the price of their products. Alternatively, by expanding credit, and assuming they have the capacity to do so without committing additional capital, the marginal cost of that credit expansion is tied to extremely low wholesale deposit rates. This is the benefit to a manufacturer of having a captive bank: expanding credit out of thin air to finance sales is low cost.

However, changes in mortgage rates do influence demand for consumer credit. Mortgage repayments for most home-owners are their largest monthly outgoings, and therefore a rise in rates restricts spending on other goods and services. Furthermore, house prices are set in the main by the cost of mortgage finance, so a rise in interest rates on mortgages has a negative impact on house values. Falling house prices are likely to make consumers more cautious.

The last thing the Fed and the Bank of England will wish to entertain is raising interest rates to the point where a house price collapse is risked. Understandably, they are very much aware of the economic consequences. In the US, roughly two-thirds of consumer debt is home mortgages. Furthermore, the last credit cycle crash was so obviously centred on residential property that central bankers and bank regulators are sure to be sensitive to trends in mortgage lending. But this is the only form of consumer borrowing that responds to increases in interest rates.

The belief that interest rates correlate with the rate of inflation is unfounded, as demonstrated by Gibson’s paradox. It springs from the fallacy that an interest rate is money’s price. The basis of monetary policy is therefore fundamentally flawed.

It should now be clear that there is a lack of knowledge at the most senior levels in central banks about the economic role of interest rates, and therefore the whole basis of monetary policy. A second fallacy is the belief that demand for credit can be micro-managed through quarter point changes in interest rates. Not only is this a reactive policy that seeks to close stable doors after the horses have bolted, but it ignores the reality that the credit cycles engineered by the central banks are the root of the problem. They cause a build-up of non-productive borrowing and investment that is only viable at artificially suppressed interest rates. Increases in interest rates, however small, will eventually trigger the sudden recognition of these distortions in the form of an interest-rate induced economic crisis. The point is that the moment a central bank begins to stimulate credit through monetary policy, it begins to lose control over subsequent events. How they then play out is our next topic.

The price effects of credit expansion

The link between changes in the quantity of credit and the effect on prices is far from simple. Credit expansion leads to balancing increases in deposits held in bank accounts, but the category of deposit-owner determines where price inflation occurs.

In the early stages of a post-crisis economic recovery, increased deposits are predominantly acquired by financial market participants, and therefore early in the recovery phase of the credit cycle financial assets begin to inflate. As bankers and brokers spend a share of their gains on non-financial items, the profits and earnings of their suppliers improve as well. These range from solicitors, accountants, restauranteurs, and builders to purveyors of luxury goods. The benefits of early credit expansion gradually raise the general price level in financial centres and within commuting distance of them, as well as in fashionable holiday resorts habituated by these early receivers of new money. As time passes, further credit expansion benefits a wider population, and prices begin to rise more generally. The effect of absorbing new money into an economy is akin to throwing a stone into a pond and watching the ripples spread outwards, until they are undiscernible.

All this assumes that the desire to hold money, rather than reduce exposure to increased money balances, remains constant. Unfortunately, this can also vary considerably.

On the scale of values, the desire to hold money can vary from zero, in which case money is completely valueless, to infinite, in which case goods have no value. The former extreme happens to unbacked state money very occasionally (both Zimbabwe recently, and Germany in 1923 come to mind). The latter is impossible, because humanity needs to buy at least food, clothing and shelter. Therefore, the effect of changes in the desire to hold money relative to goods can have a significant impact on prices, a factor wholly beyond the central banks’ control.

Consequently, there are two major elements driving the relationship between the quantity of money and prices to consider, as the credit cycle progresses: who is benefiting from credit expansion, and variations in the general desire to hold money relative to spending it. In this credit cycle, those that have benefited most so far have been predominantly people holding financial assets, where price inflation has been rampant. The news last week, that Janet Yellen and Mark Carney now think a more aggressive interest rate policy is appropriate, tells us that their institutions have detected a shift in the application of credit. This being the case, the engine of price inflation will become refocused from financial assets towards the economy as a whole.

In other words, demand for bank credit from non-financial businesses is picking up, and banks are more willing to lend to them. It is undoubtedly this development that has encouraged the Fed to rein in the expansion of bank credit by reversing quantitative easing. But while there will always be some room on bank balance sheets to expand credit, most of the increase in credit aimed at non-financial activities must come from the sale of financial assets, particularly short-term US Government bills and bonds. And if the Fed tries to reduce its balance sheet at the same time, the fall in bond prices will be greater for it.

Therefore, bond yields will rise, possibly quite sharply, and the central banks have no option but to sanction increases in short-term interest rates. Hence the interest rate signal, which instead of being a leading indicator of trends, as everyone believes, reflects developments already in the market, being led by demand for non-financial credit.

The increase in the supply of credit to non-financial businesses will increase the bank balances of their suppliers as the credit is drawn down, leading to a temporary increase in their holdings of money relative to goods. These deposits in turn are then spent on goods and services.

Demand for goods and services, over and above that already supplied to consumers in the form of mortgages, credit cards, auto and student loans, will therefore have an additional credit stimulus from money flows previously tied up in financial assets. Ownership of cash and deposit balances held at the banks shifts from participants in financial markets towards suppliers of goods and services, which they will then spend on components in the consumer price index.

Credit expansion in favour of the non-financial sector also increases nominal GDP, which is simply a money total that measures consumption. At last, say the pundits, the economy is picking up. Profit forecasts will be revised upwards. Yet, the rise of government bond yields will be calling time on equity bull markets, which in truth have only reflected suppressed interest rates and bond yields held down by extra credit supply absorbed by financial markets.

The central banks’ nightmares have only just started. They have already lost control of interest rates, because the banks have begun to lend to Main Street, hence Yellen and Carney’s warning of interest rate increases. Equities and bonds, central to earlier policies of wealth creation are turning into engines of wealth destruction. We are now entering a period when the cost of credit, measured in real terms, is about to fall to the lowest level in the credit cycle.

Why real interest rates will become more negative

As the non-financial economy inflates on the back of credit expansion, the character of the credit cycle undergoes significant changes. As we have seen, bank credit is withdrawn from financial activities, to the detriment of financial asset values. It leads to significant selling of short-term government bonds by the banks and the loss of bullish momentum in equity markets, which then enter a bear market. The public tends to be buyers of equities at this stage, because analysts will be revising their profit forecasts upwards, seemingly justifying market valuations. But the error that the public makes is to assume share prices are driven by valuations, when they are driven by monetary flows.

The flow of bank credit from financials into non-financials will gather pace, encouraged further by falling bond prices, and the banks reducing their assessments of lending risk to the non-financial economy. The banks can even end up competing to lend, and suppress their lending rates by the simple expedient of expanding credit. If a significant number of banks are competing in this manner, deposit rates in the money-markets will be suppressed in turn, reducing their average cost of deposit funding, irrespective of the Fed funds rate.

Meanwhile, price inflation begins to accelerate as increasing quantities of bank credit end up being spent on goods and services. The combination of an increase in the general price level and competition to lend will, in real terms, lead to negative interest rates once higher price inflation is considered. The continuing suppression of nominal rates by central banks, doubtless worried about wealth destruction in financial markets, is likely to result in the greatest level of negative real rates of the entire credit cycle. The central bank is reluctantly forced to raises its lending rates in a belated attempt to keep up with economic developments. While this has been the evolving situation from the start of this expansionary phase, it will then become increasingly obvious that the public’s preference for money will swing progressively towards preferring goods, as they realise that money’s purchasing power is accelerating its decline.

Spending on goods of a higher order, or capital goods, increases as well, driven not only by reassessments of the nominal value of their production, but also by the desire to reduce cash balances. But unless bank credit contracts, the money disposed by one party ends up being owned by another, who will equally not wish to hang on to it. This is particularly noticeable in purchases of residential and commercial property, late in the credit cycle.

Contrary to the impression often given by financial commentators, property is not a financial asset, being non-financial in both origin and use. The fact that rentals give a monetary return is no different from any other non-financial, or productive asset. Property becomes an obvious destination for investors’ money fleeing falling values in financial assets.

Despite initial rises in nominal borrowing costs and bond yields, property becomes increasingly viewed as a solid asset, and as protection from the decline in money’s purchasing power. Obviously, the price performance of different categories of property can be expected to vary, depending on their exposure to rising nominal interest rates. Residential property markets, when they are highly dependent on mortgage finance, are likely to underperform. The growth of online sales has suppressed the utility of shopping malls and high street retail space. But despite these problems, there is little else available for capital fleeing bond and equity markets. For investors, bricks and mortar are seen to be the natural alternative to financial assets and a depreciating currency, late in the credit cycle.

Again, it is all about flow of funds. Follow the money. Only this time, instead of inflating investment values, the prices that will be inflated are of goods, services and their associated capital assets.

Not all jurisdictions are the same

All major nations are subject to the credit cycle. Attempts by central bankers to coordinate monetary policies through regular meetings at The Bank for International Settlements and at G20 meetings have ensured the eventual crisis phase will be truly global. Furthermore, the global distortions from first stoking up credit demand and then failing to control the consequences are magnified because of this coordination.

To further confuse observers of this multi-dimensional puzzle, in between credit crises the rate of progression from the recovery phase to expansion varies, and the volume of the credit flows, relative to the size of an individual economy, first into and then away from financial markets, varies as well. This leads to significant anomalies. The US and UK have very high levels of consumer credit exposure, and residential mortgage totals are also elevated. The expansionary phase has been running for some time in South East Asia, perhaps replicating the conditions that led to the Asian crisis in the late 1990s. The switch in interest rates will be greatest in Japan and the Eurozone, where negative interest rates persist, but these jurisdictions overall have a greater propensity to save than their Anglo-Saxon confrères. China plans to expand her way out of the eventual credit crisis, relying on state control through ownership of the banks. Russia, Australia, the Middle East and Africa are tied to a cycle of commodity prices, driven in turn by the expansionary phase of the global credit cycle.

Different places, different strokes. But at least the bones of the credit cycle are being laid bare. Eventually, the expansionary phase of the credit cycle becomes so obviously out of control that central banks will have little option but to try to protect their currencies’ rapidly declining purchasing power. This was the decision faced by Paul Volcker in 1981, when he was the Fed’s chairman. He raised the Fed funds rate to a staggering 20% that June. This time, Ms Yellen (if she is still in office) need only raise the FFR by a few percentage points before the crisis is triggered, given the high levels of accumulation of unproductive debt in the US economy today.

The lower ceiling for a rise in nominal rates becomes a limitation on the duration of the expansionary phase. It will be apparent a lot more quickly that central banks have very little room for manoeuvre on interest rates. The authorities might even try to put off the crisis phase by imposing price and wage controls, in the knowledge that at best, they might buy some time.

- Source, Alasdair Macleod of James Turk's Gold Money